


How to Read a Nautical Chart
Depths in fine print, contour lines that hide a sandbank, buoys whose colors are not what they look. A working guide to the document every American boater is expected to understand.
A nautical chart is the closest thing on board to a contract with the water. It promises nothing, but it tells the truth about depth, distance, hazards, and the geometry of the route you have chosen. Learning to read one is less a matter of memorizing symbols than of training the eye to ask the same questions the chart was designed to answer.
In the United States, the authoritative chart catalogue is published by the National Oceanic and Atmospheric Administration through its Office of Coast Survey. Symbols, abbreviations, and terminology used on those charts are defined in U.S. Chart No. 1, a free reference published jointly by NOAA and the National Geospatial-Intelligence Agency. Every serious cruiser has a copy on the boat or bookmarked on the tablet. It is the closest thing the trade has to a dictionary.
A paper chart and a digital chart show essentially the same world. The data model behind them, the IHO-standardized vector layer known as the ENC, is the same in both formats, and the symbol set is consistent. What changes is the interface. Paper rewards a slow eye and a parallel rule. The digital chart, displayed on a plotter or tablet, layers tide data, AIS targets, route history, and zoom. Each is complete on its own. Most experienced boaters carry both and let one watch the other.

Anatomy of a chart
Every chart opens with three pieces of information the eye should find before reading anything else. The scale, which fixes the ratio between distance on the page and distance on the water. The title block, which states the area covered, the chart number, the edition date, and the corrections in force. And the units, which determine whether the depths printed on the chart are in feet, fathoms, or meters. Mixing those up is not a small mistake; it is the chart equivalent of confusing miles and kilometers, and every grounding case files it under the same heading.
Once the orientation is set, the eye moves to the chart's vertical datum, the reference level for every depth on the page. Most U.S. coastal charts use mean lower low water, the average of the lower of each day's two low tides over a tidal epoch. That means the depths shown on the chart are conservative; the actual water under the keel will usually be more, except in the rare moments of negative tide when the level drops below the datum and the chart number quietly becomes optimistic. The same logic applies above the water: clearances under bridges and cables are referenced to mean high water, the opposite extreme.
U.S. Chart No. 1, published by NOAA and NGA, is the official key to every symbol, abbreviation, and term on American nautical charts. It is free to download from the NOAA Office of Coast Survey. Edition 13, released in 2019, is the version most boaters work from today.
A chart is also a snapshot of its own time. Coastlines move. Sandbars migrate. New wrecks join the bottom and old ones erode. NOAA publishes weekly corrections through the U.S. Notice to Mariners, and the chart's edition date plus the last applied correction tell you how current you are. A paper chart printed five years ago and never updated is a piece of historical decoration, not a navigation tool. The digital equivalent is the chart on a plotter that has not received an ENC update in eighteen months. Both look the same; both lie in the same places.
Reading the field
A chart looks crowded only until the eye sorts its information into layers. The first layer is the bottom. Depths appear as numbers scattered across the water, each one a sounding measured at a single point and reduced to the chart datum. Lines connecting equal depths are contours, drawn at standardized intervals; the closer the contours, the steeper the slope underwater. Shaded blue bands mark shallow zones, with progressively darker tones as the water deepens. The pattern alone, before reading a single number, tells you where a sandbank rises and where a channel cuts through.
The second layer is the obstacle catalogue. Rocks, wrecks, snags, fish traps, submerged pilings, kelp beds: each has its own symbol, and most are clustered along coastlines or near former working waterfronts. A rock that uncovers at low water is drawn differently from one always submerged. A wreck with masts above the surface gets a different mark from one that lies entirely below. None of these symbols is decorative. Each is a small advisory drafted by hydrographers who, in many cases, found the obstacle by accident or by report from a vessel that did not survive the meeting.
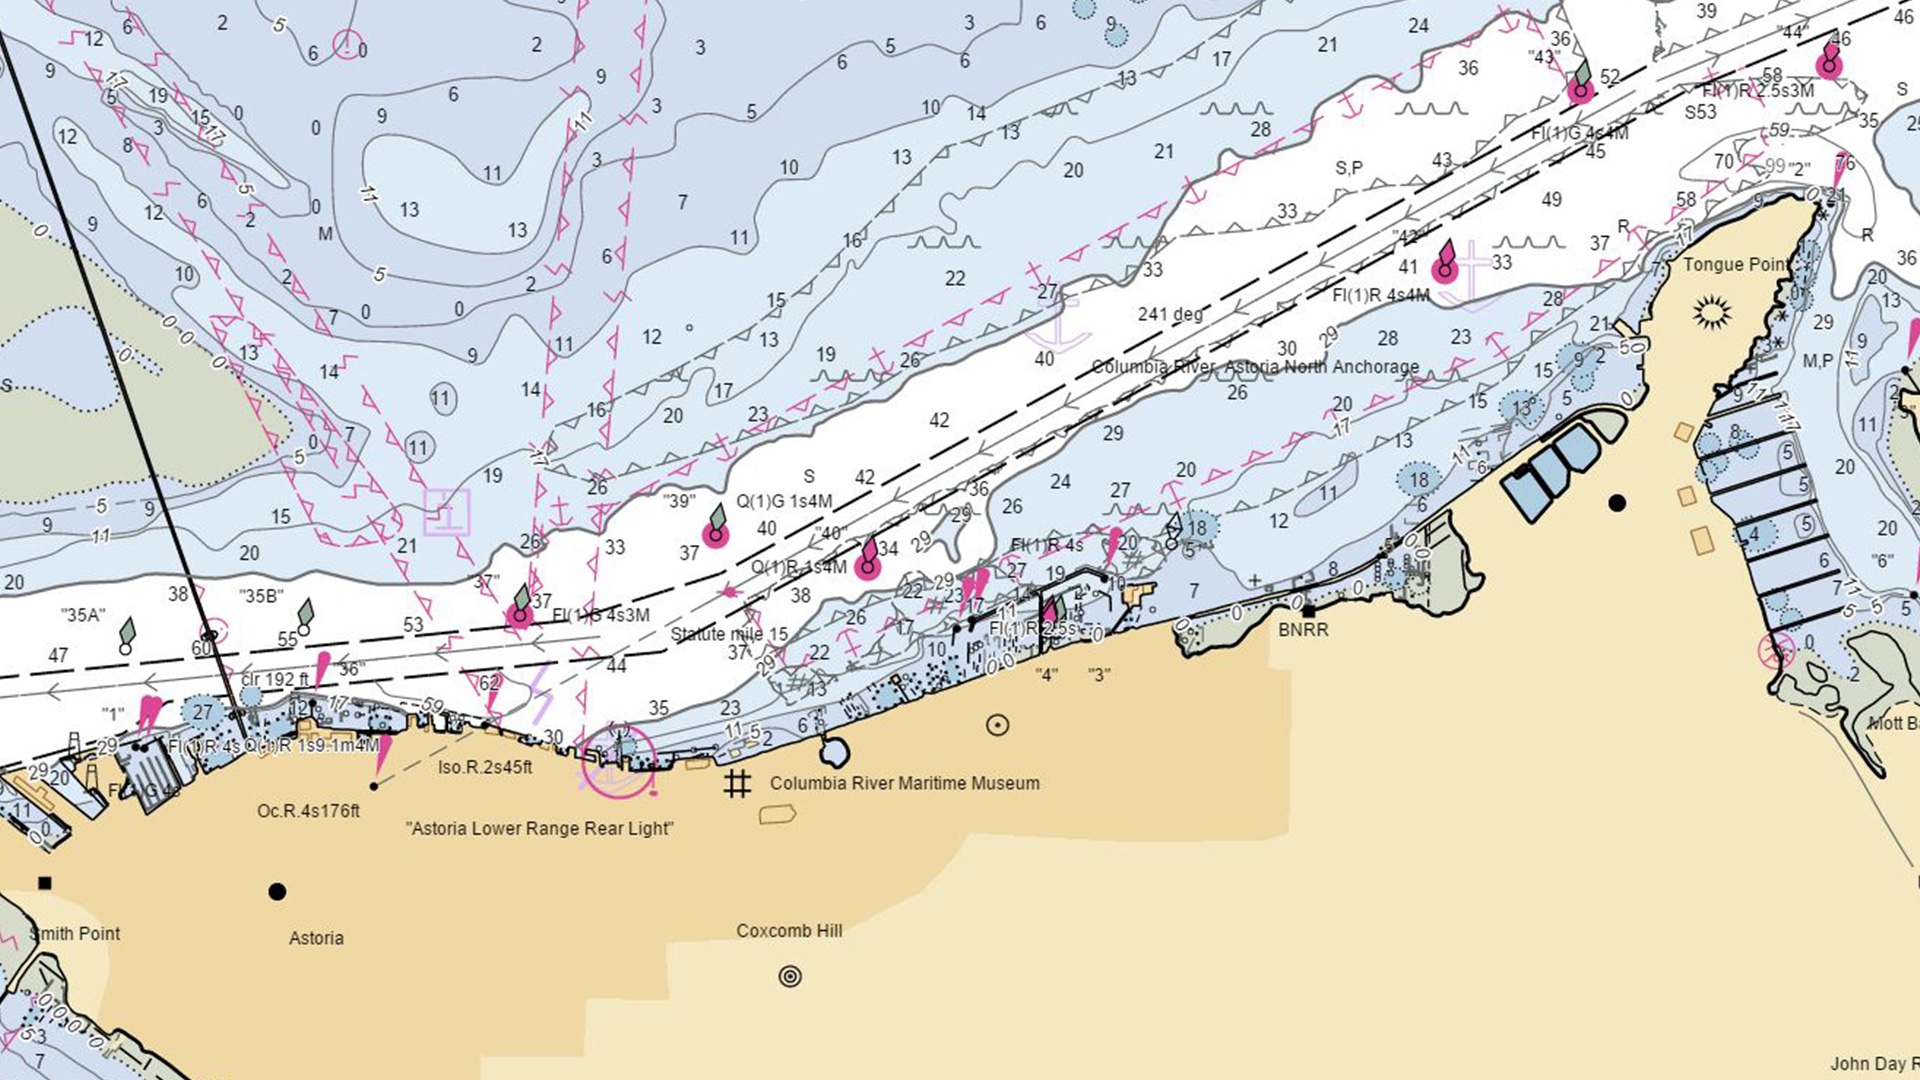
Soundings, contours, and obstacles The closer the contour lines, the steeper the bottom underneath.
The third layer is everything that lives above the surface. Lighthouses, lighted buoys, daymarks, ranges, and prominent landmarks visible from the water. Each light is identified by its color, its flash pattern, its period, and its height above water. A symbol that reads Fl R 4s 15ft "4" describes a buoy that flashes red every four seconds, mounted fifteen feet above the water, numbered 4 on the chart. Once the convention is internalized, the chart starts to speak almost like a paragraph. The same five abbreviations recur thousands of times across U.S. waters.
Four families.
Every chart speaks through them.
I
Depth
Soundings · Contours
Numbers reduced to the chart datum, contour lines at standardized intervals, and graduated blue tones marking shallow water. Read the units before reading the number.
II
Hazards
Rocks · Wrecks · Shoals
Symbols differentiate by exposure: always submerged, awash at datum, or visible at low water. Wrecks are drawn for visibility above the surface or location below it.
III
Aids to Navigation
Lights · Buoys · Daymarks
Each light is identified by color, flash pattern, period, height, and identifier. The abbreviation Fl R 4s reads as flashes red every four seconds.
IV
Restricted Areas
Boundaries · Regulations
Hatched lines and notes identify anchorages, military zones, environmental reserves, cable areas, and seasonal closures. The chart cites the regulation by reference.
“
A chart is a snapshot of its own time. Coastlines move. Wrecks join the bottom. The version on board matters more than the symbol you are reading.
Field Note · USA Onboard Editorial
Buoys and the rule of red right returning
The buoyage system used in American waters is IALA Region B, the convention shared with Canada, the rest of the Americas, Japan, Korea, and the Philippines. Most of the rest of the world, Europe and Australia included, uses IALA Region A, where the colors of the lateral marks are reversed. The distinction matters for any vessel that crosses oceans, because the same red can mean two different sides depending on the hemisphere.
In Region B, the mnemonic that every American boater eventually internalizes is red right returning. When returning from open water toward a harbor, channel, or upstream, red lateral marks are kept on the starboard side and green marks on the port side. Outbound, the relationship reverses. Red buoys are conical, even-numbered, and may carry a red flashing light. Green buoys are can-shaped, odd-numbered, with a green light. Both kinds are numbered in sequence so a boater can confirm progress along the channel, mark by mark.
Other marks complete the system. Cardinal marks, banded in black and yellow, indicate the side of a hazard on which the safe water lies, using a compass logic of north, east, south, west. Isolated danger marks, black with one or two red bands, sit directly above an obstruction surrounded by navigable water. Safe water marks, painted in vertical red and white stripes, are placed in deep, navigable water and often mark the entrance to a fairway. Special marks, in plain yellow, identify areas of administrative interest, such as fish farms, cable runs, or research zones. None of these vary between IALA regions. They are read the same way worldwide.
The full buoy alphabet
Buoys are the chart speaking out loud. Where the chart shows a symbol, the buoy in the water repeats the same information through shape, color, and light. The four families below cover almost every aid to navigation a recreational boater will encounter in U.S. waters. Each works whether the chart is paper, digital, or, increasingly often, both at once.
Four families.
Read by shape, color, and light.
Lateral Marks
Red & Green
Channel sides
Mark the edges of a channel. Red right returning: keep red to starboard when heading in from open water. Red is conical and even-numbered; green is can-shaped and odd-numbered.
Cardinal Marks
Black & Yellow
Direction of safe water
Indicate the compass quadrant where the navigable water lies relative to a hazard. North, east, south, west variants identified by topmarks and light rhythm.
Safe Water Marks
Red & White
Vertical stripes
Mark fairway approaches and centerlines in navigable water on all sides. Often the first mark a boater sees when coming in from offshore.
Special Marks
Yellow
Administrative
Identify areas of administrative interest: aquaculture, cable runs, pipelines, research zones, traffic separation, dredging operations. Not a navigational mark in the strict sense.
Two refinements complete the picture. Isolated danger marks, black with one or two red horizontal bands and twin black topmark spheres, sit directly over a discrete obstruction surrounded by navigable water. Preferred channel marks, banded red and green, indicate that a channel divides and signal which side leads to the main route. None of these are conventions invented locally. They are the same in every IALA Region B nation, which is why a chart drawn in Maine reads the same way as one drawn in the Bahamas.
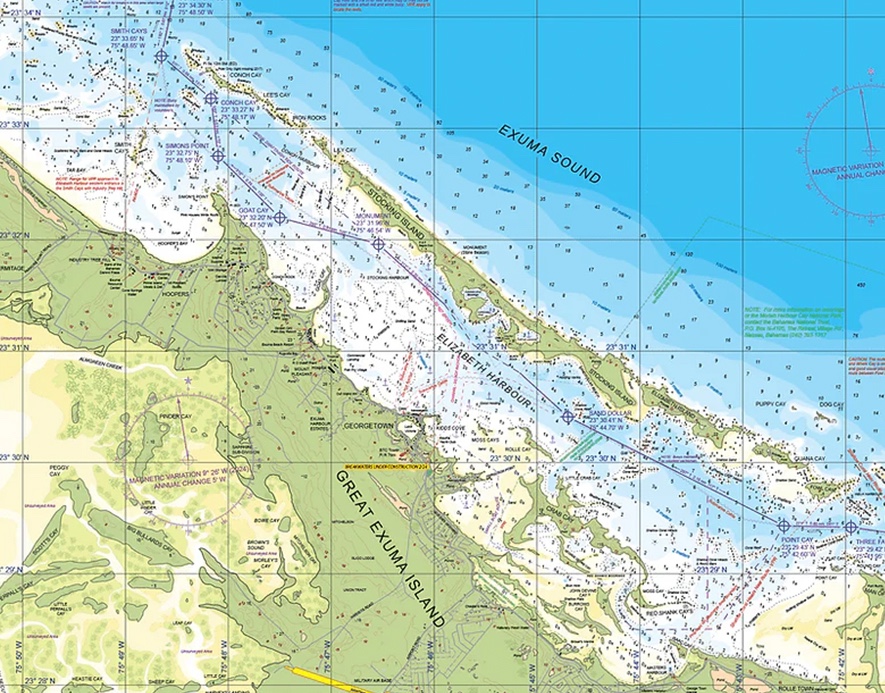
A chart of the Exumas The same conventions used along the U.S. coast, applied to coral water.
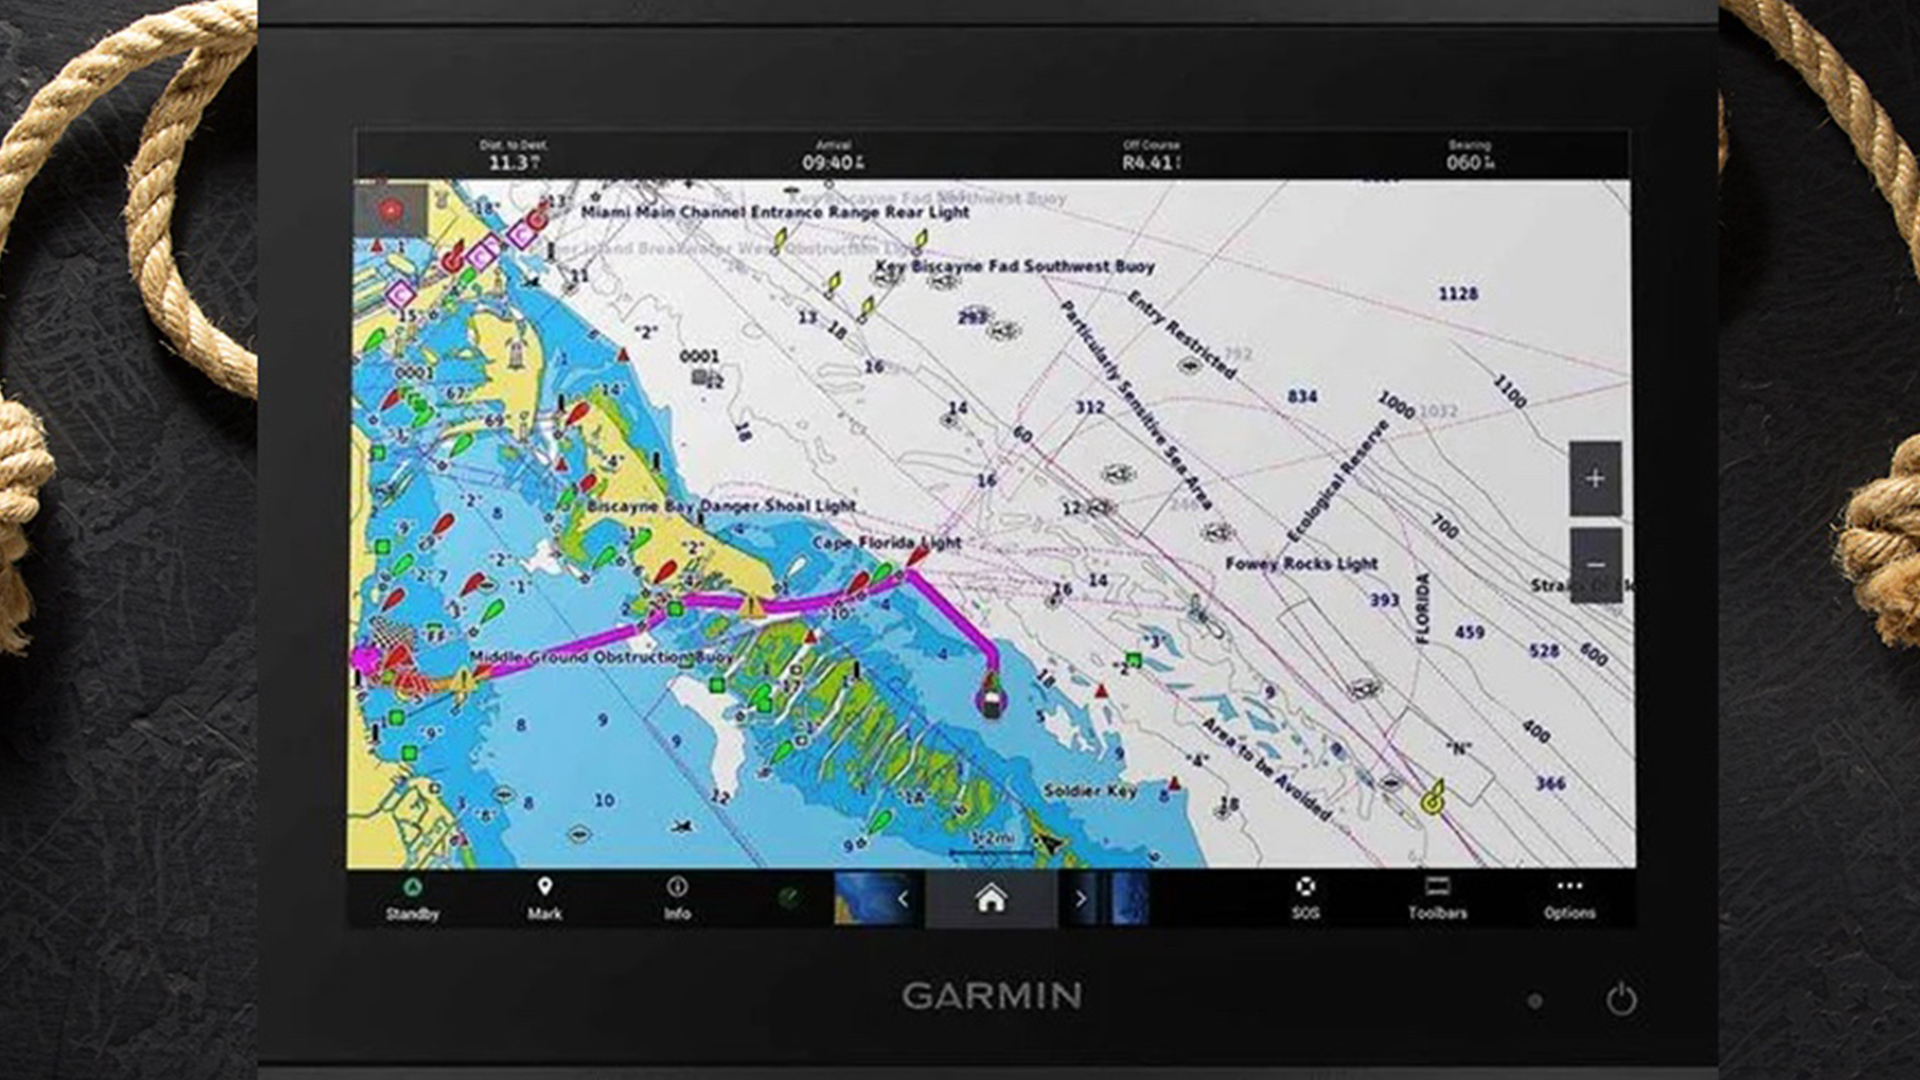
From planning to the helm
A chart's value is mostly realized before the engine starts. Plot the route with the eye on every hazard the chart flags: sandbanks, isolated rocks, restricted areas, low bridges, shallow contours that approach the rhumb line. Mark waypoints where a course change is required and verify that no leg of the route runs through a problem area. Compare the planned passage against the tide table for the day; the most exposed sections should be transited at high water whenever possible, both for clearance and for the small grace the rising tide grants in case of a grounding.
Wind and current belong on the same planning page. Both produce leeway and set, which act on the boat continuously and silently. A breeze on the beam can push a vessel half a mile off rhumb over an hour, and a flooding tide along a narrow channel can do as much. The chart shows magnetic variation, prevailing currents in many areas, and tidal stream arrows where the current pattern is well surveyed. None of these excuse skipping the GPS, but each one explains why GPS alone is not a substitute for a chart.
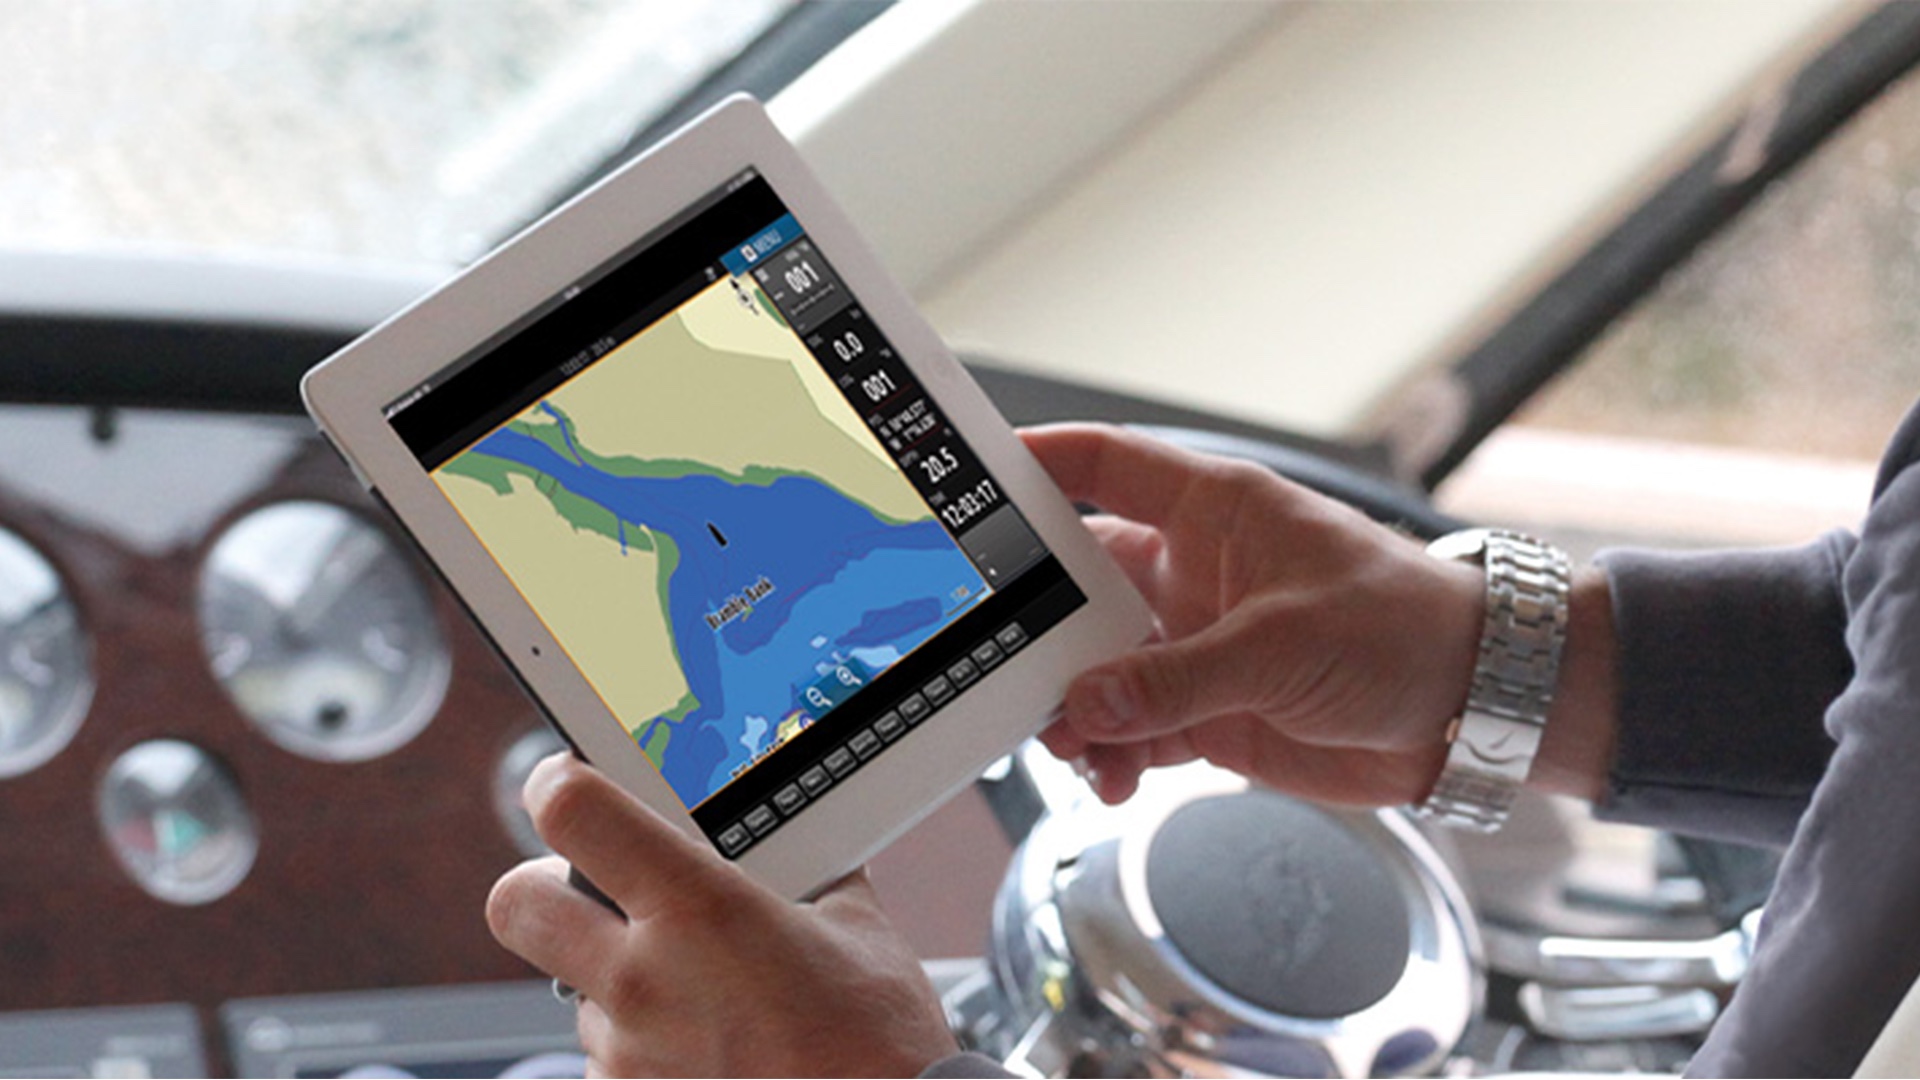
The instrument on board confirms; it does not lead. A GPS or chartplotter shows position, course over ground, and speed, but the prudent boater still asks the chart what is supposed to be in that water. The two answers should agree. When they do not, the right move is to stop, anchor or hold position if safe, and resolve the discrepancy before continuing. Most of the rocks named after vessels were found by boaters who trusted the screen and did not look at the chart.
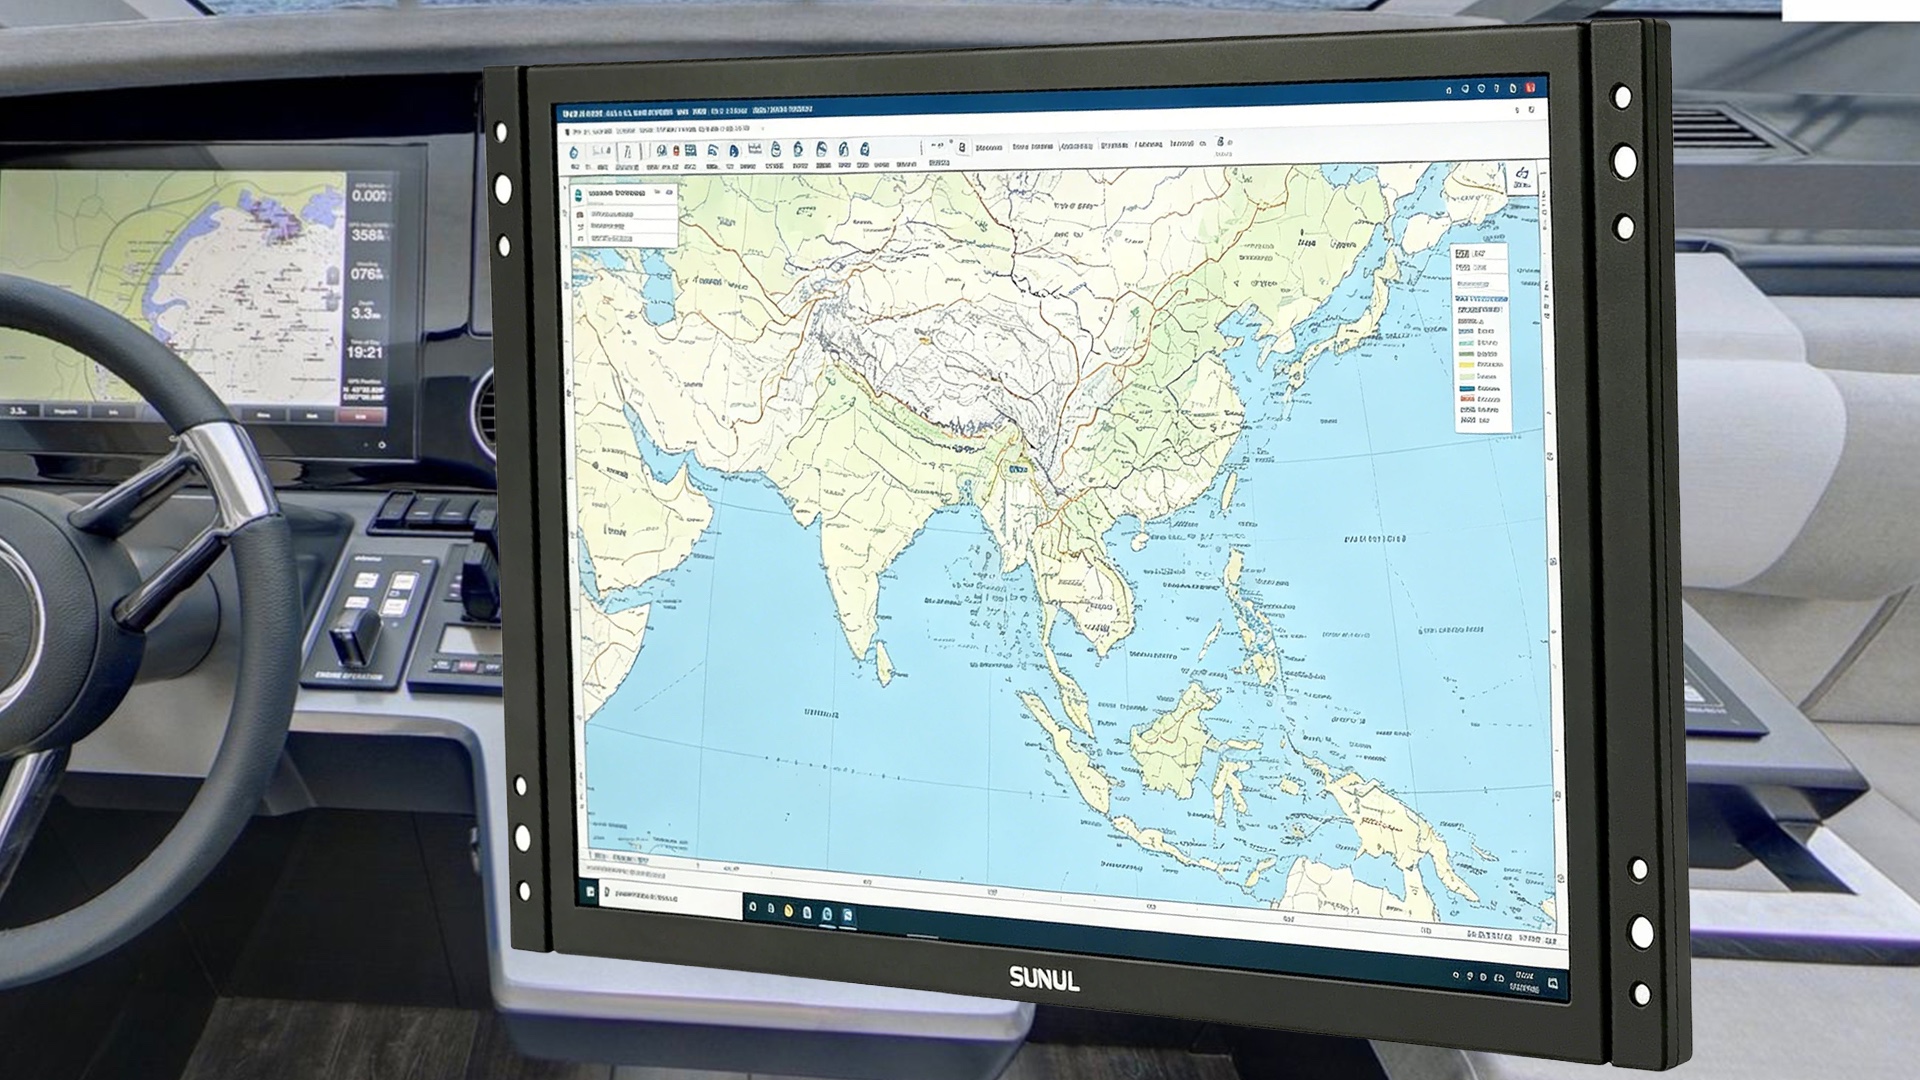
At the helm The plotter shows position. The chart still has to be read.
Two short lists worth keeping.
Reading the Chart · Do
- Check edition date and last applied correction before relying on any chart.
- Confirm units. Feet, fathoms, or meters change everything that follows.
- Read soundings against the chart datum, not against the current tide.
- Plan the route on the chart first; verify against the GPS after.
- Cross-check buoy markings on the water against the symbols on the chart.
Reading the Chart · Don't
- Assume Region B buoyage abroad. IALA Region A reverses the colors.
- Treat depth contours as static. Sandbars and shoals migrate season to season.
- Skip the title block. Scale, datum, and corrections live there.
- Trust the GPS when the chart disagrees with it. Stop and reconcile.
- Use a chart years out of date. Edition currency is not a formality.
A nautical chart is not a map. It is a working document drawn for the moment a boater has to decide whether the next mile is safe to run. Read it as such, keep it current, and let it do what it was made to do.
USA Onboard Editorial